Intelligent Analysis and Chart Generation
After the business domain is constructed, users can perform visual analysis in the "Data Insights" module.
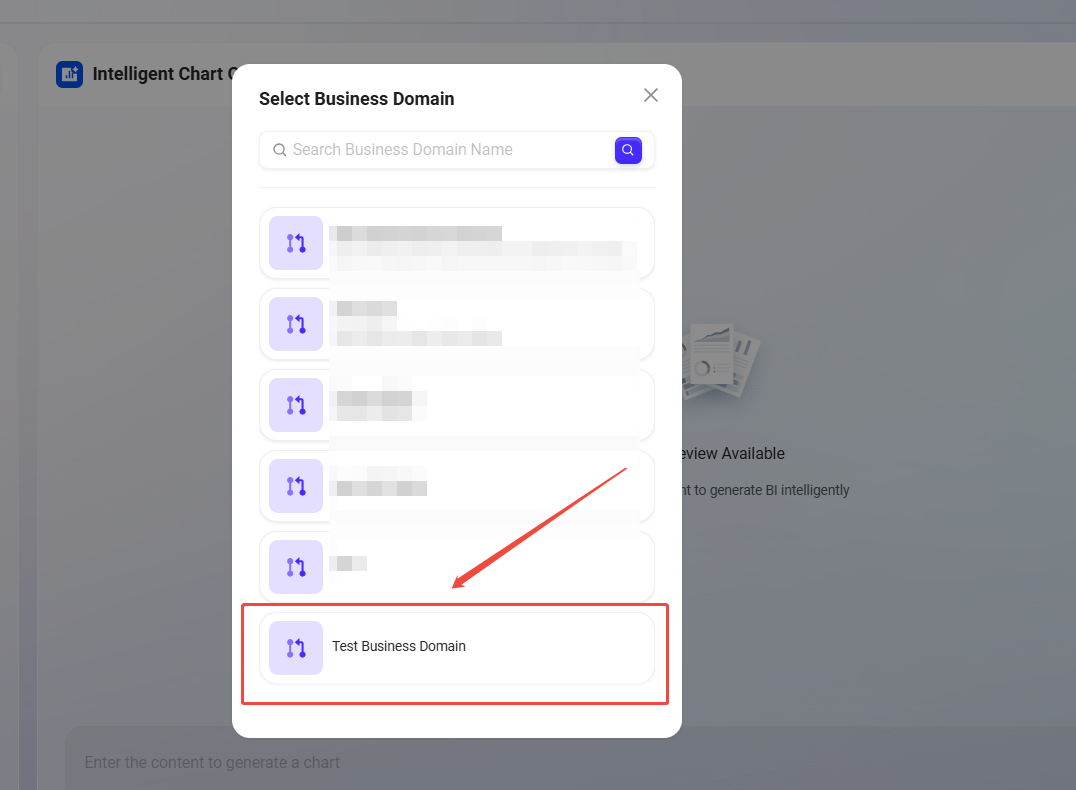
1. Select Business Domain
-
After entering Intelligent BI, select an existing business domain;
-
The data tables under the domain will be displayed on the left;
-
Supports data table preview, including field names and sample data.
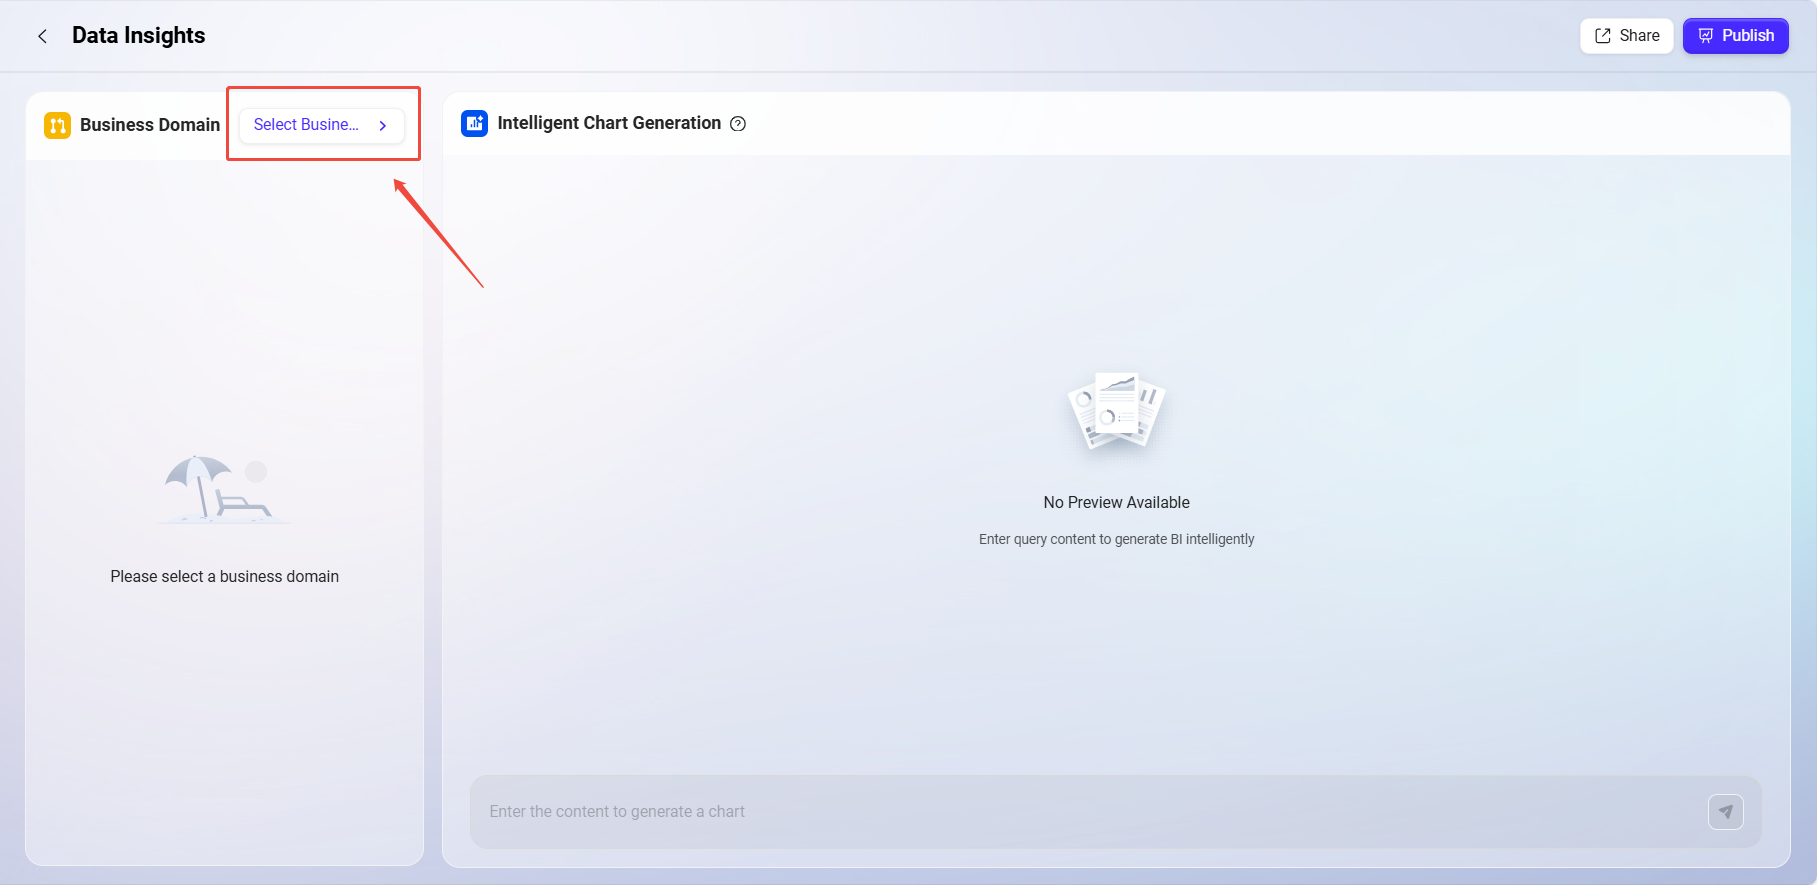
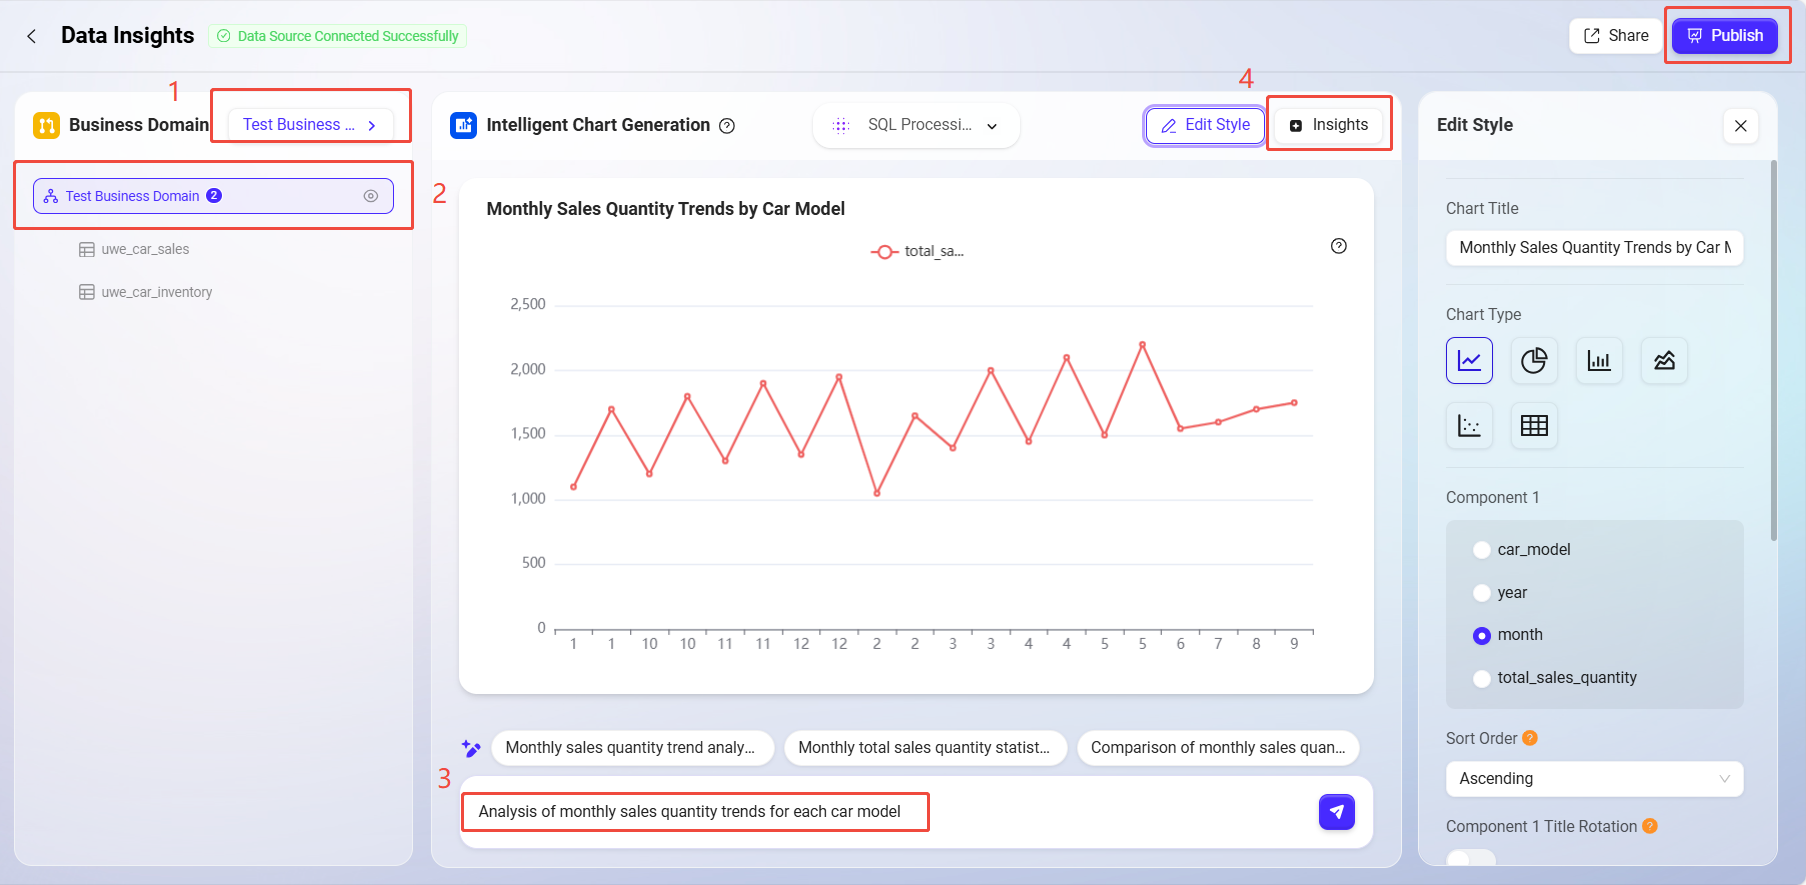
2. Intelligent Chart Generation
-
Enter chart requirements in the input box, supporting natural language queries, such as:
-
"Monthly sales quantity trend analysis for each car model"
-
-
The system automatically converts the query into SQL based on semantic recognition and generates the corresponding chart;
-
Supports various chart types including bar charts, line charts, scatter plots, etc.;
-
Optimizes and suggests completions for user input, very suitable for business users without technical knowledge;
-
Charts support editing, including title, chart type, XY axis settings, color style, etc.
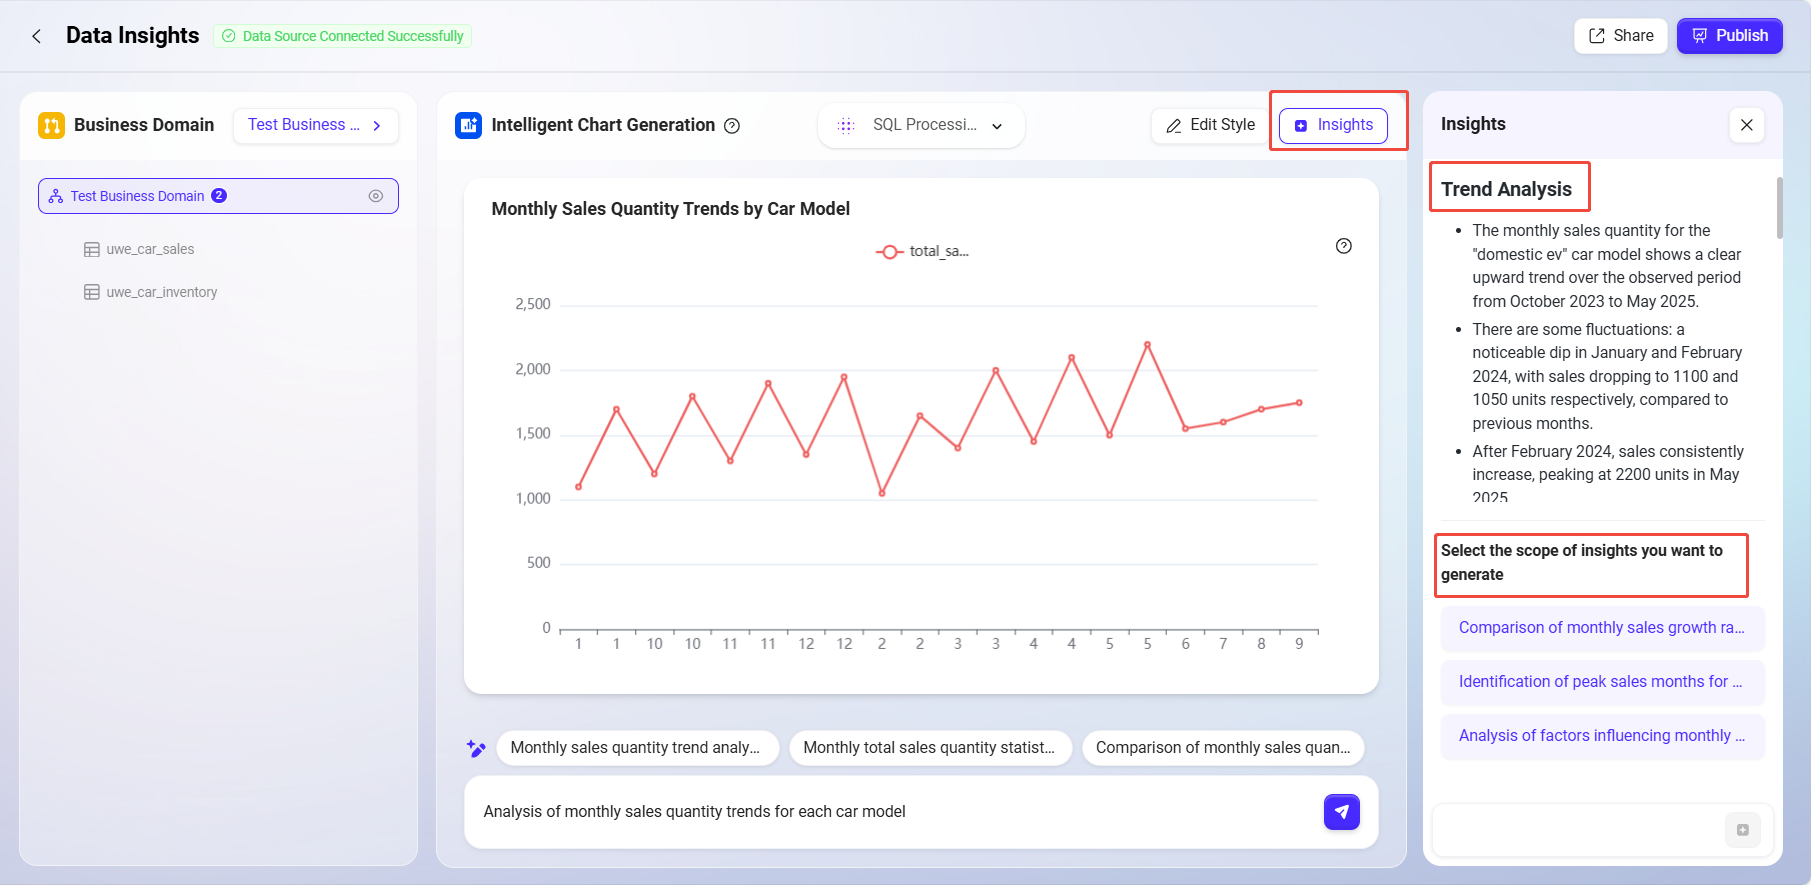
3. Data Insight Analysis
-
On the right side of the BI interface, click "Insights";
-
The system uses AI to automatically analyze data trends, anomalies, and possible causes;
-
Helps users quickly identify key business issues and supports business decision-making.
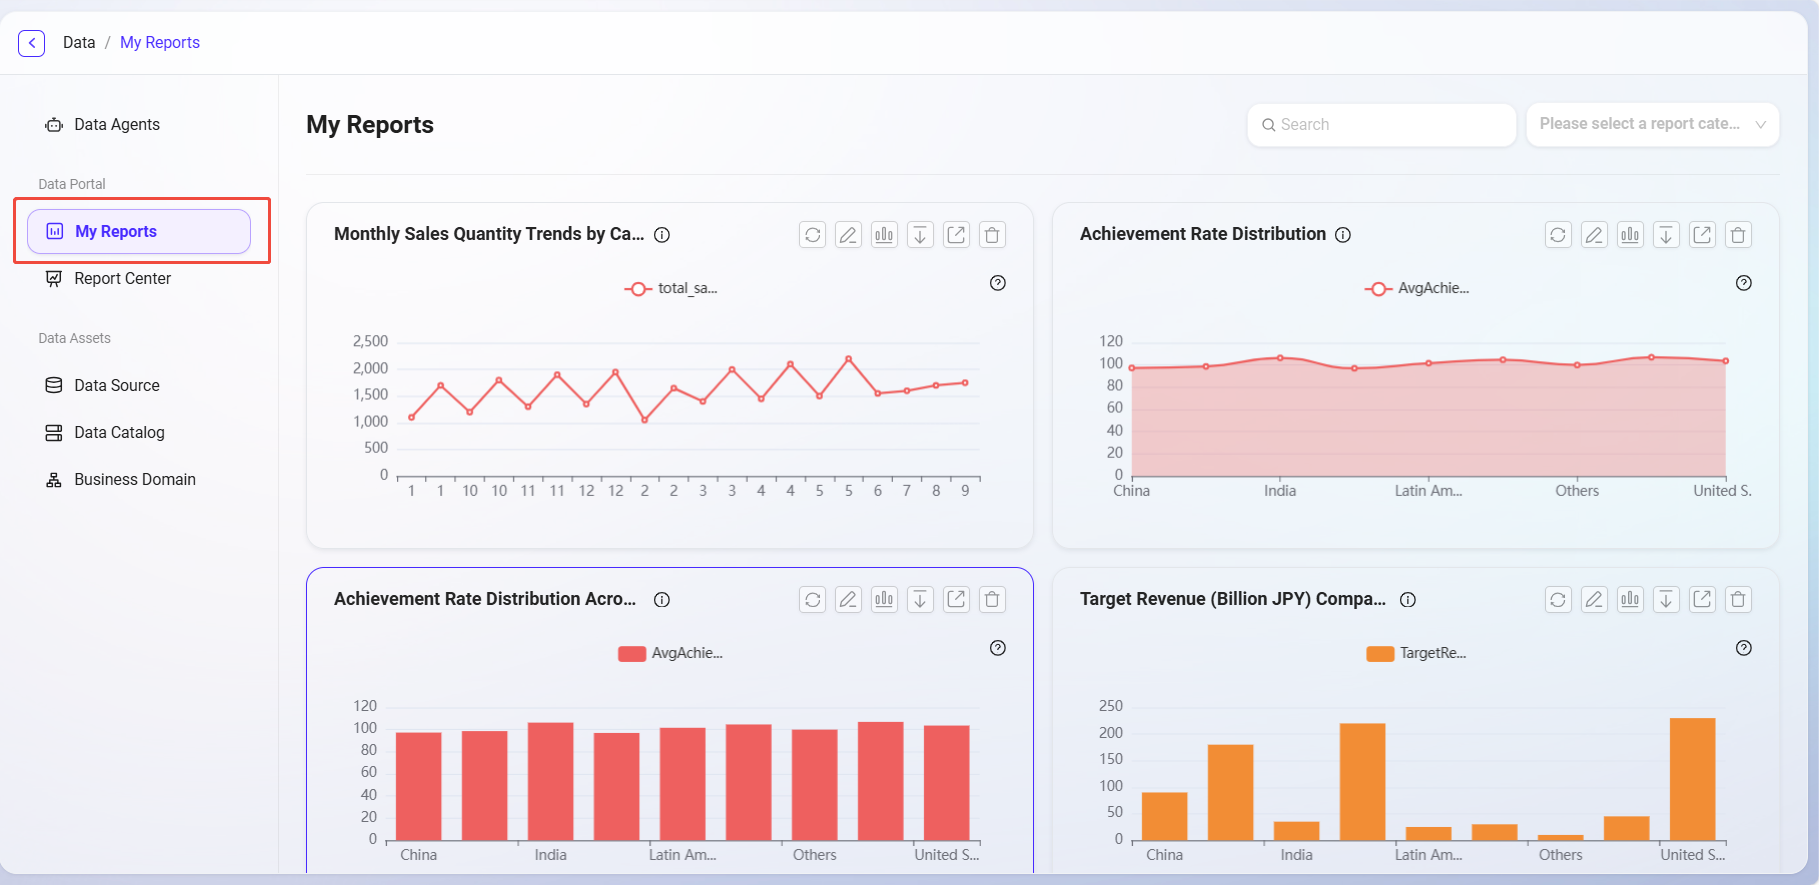
My Analysis & Analysis Center
Analysis Publishing and Sharing
After completing analysis adjustments, the analysis can be published and shared.
1. Analysis Publishing
-
Supports publishing analysis to:
-
My Reports (personal visibility);
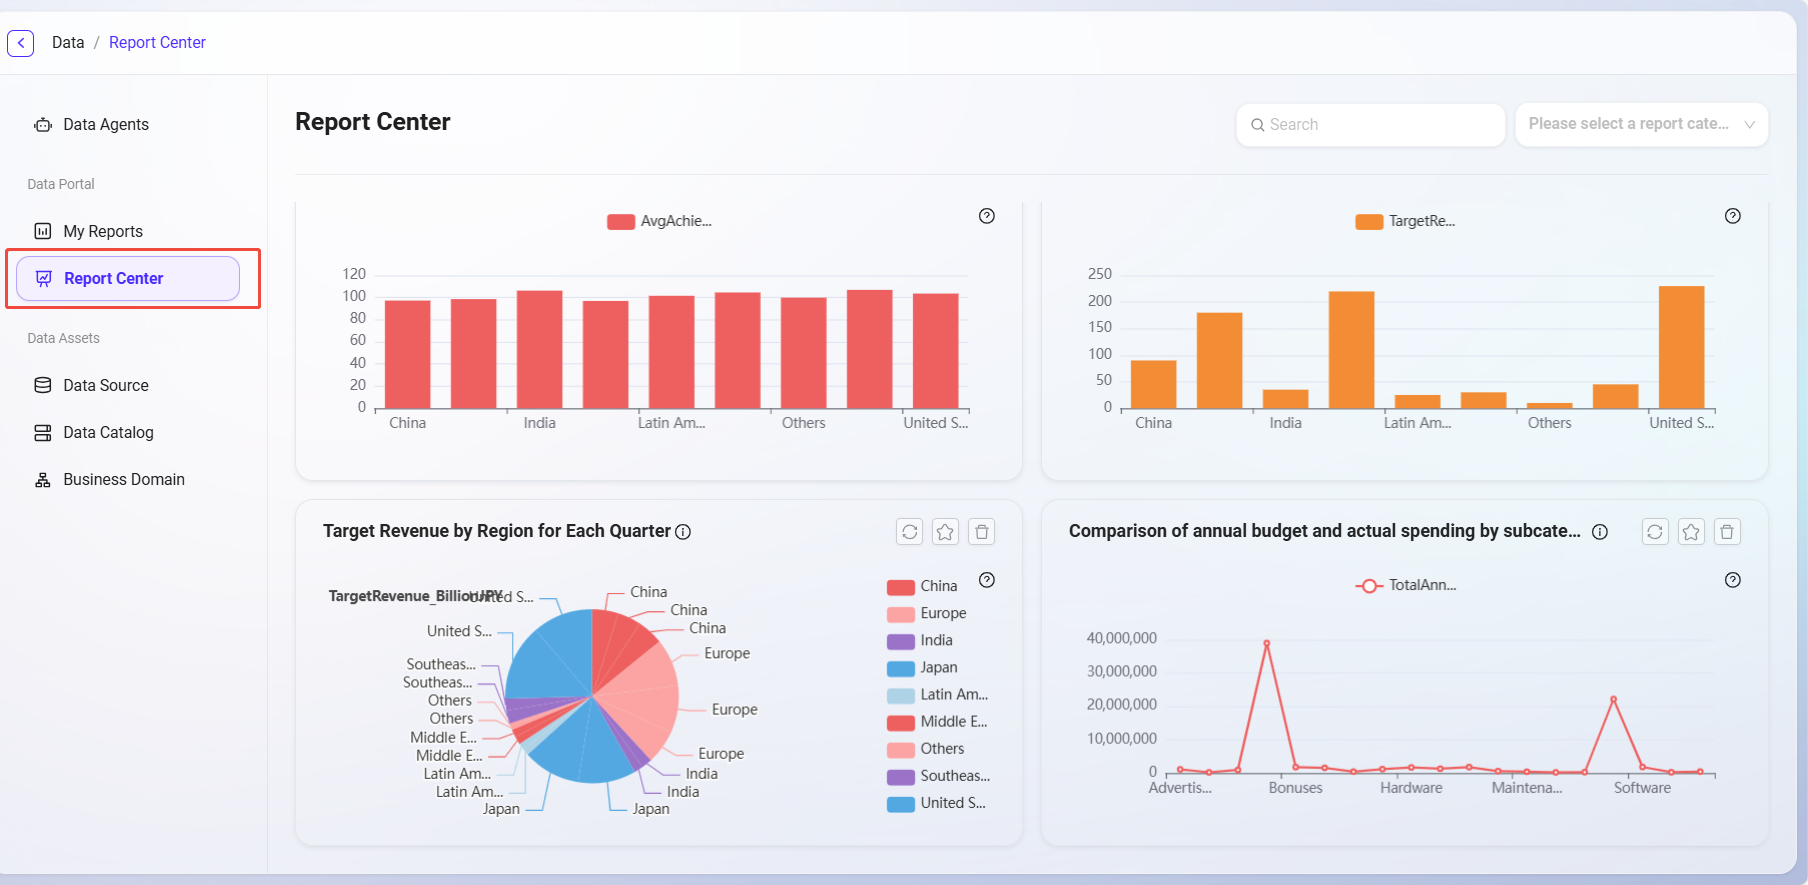
-
Report Center (organization sharing);
-
-
Supports setting and selecting analysis categories during publishing.

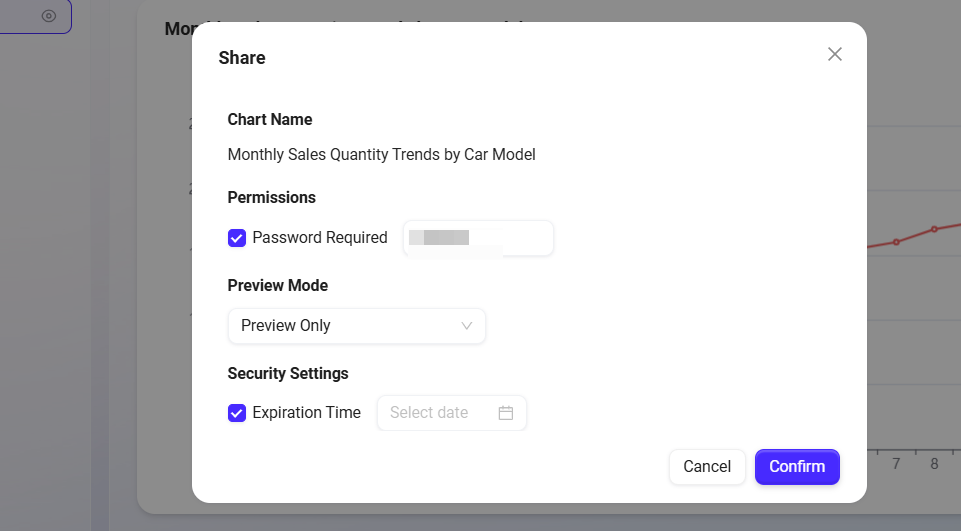
2. Analysis Sharing
-
Supports settings for:
-
Whether to enable password protection;
-
Access permissions (view only);
-
Expiration time limit;
-
-
Can quickly share with others via link.
3. Analysis Management
-
In "My Reports", users can edit, rename, share, download, or delete published analyses;
-
The "Report Center" provides a global summary of analyses, supporting category viewing and favoriting.